canvas - 下
34:canvas - 下
一、转换
- 在canvas内,也可以像css一样有一些类似于css2D转换的效果
- 位移
- 语法:
ctx.translate(x, y) - 注意:一定要在绘制(描边或填充)之前,进行位移
- 语法:
- 缩放
- 语法:
ctx.scale(x, y) - 注意:一定要在绘制(描边或填充)之前,进行缩放
- 语法:
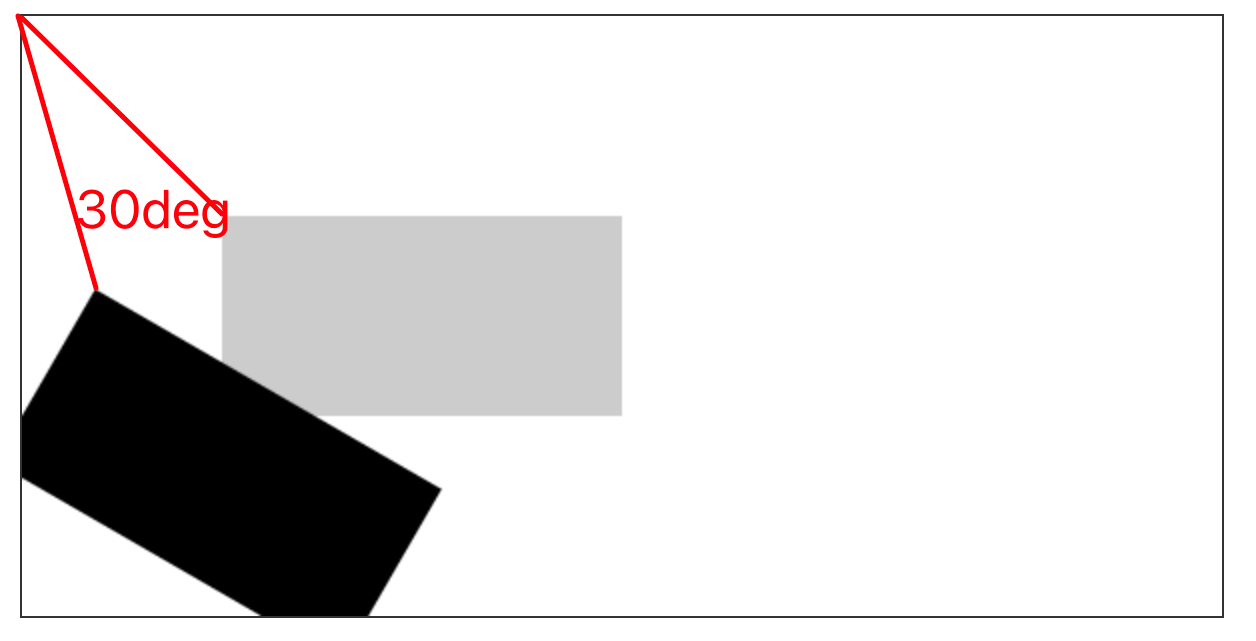
- 旋转
- 语法:
ctx.rotate(弧度值)- 角度转弧度公式:
弧度 = Math.PI/180*角度
- 角度转弧度公式:
- 注意:一定要在绘制(描边或填充)之前,进行旋转
- 语法:
- 转换的中心都是画布的 0,0 点,可以配合 位移 修改旋转或缩放的中心
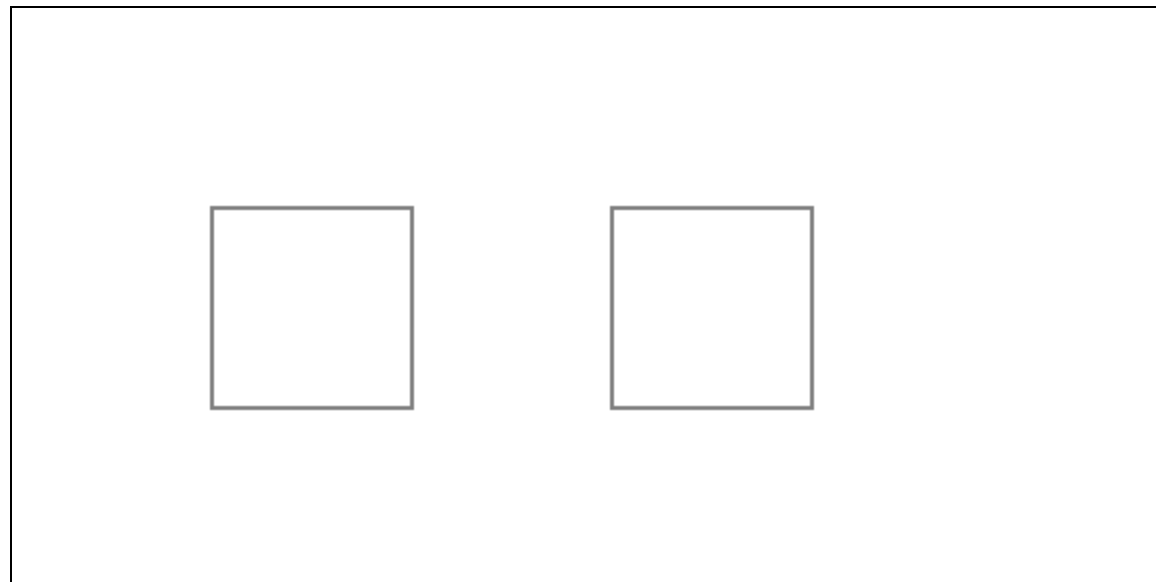
- 注意:
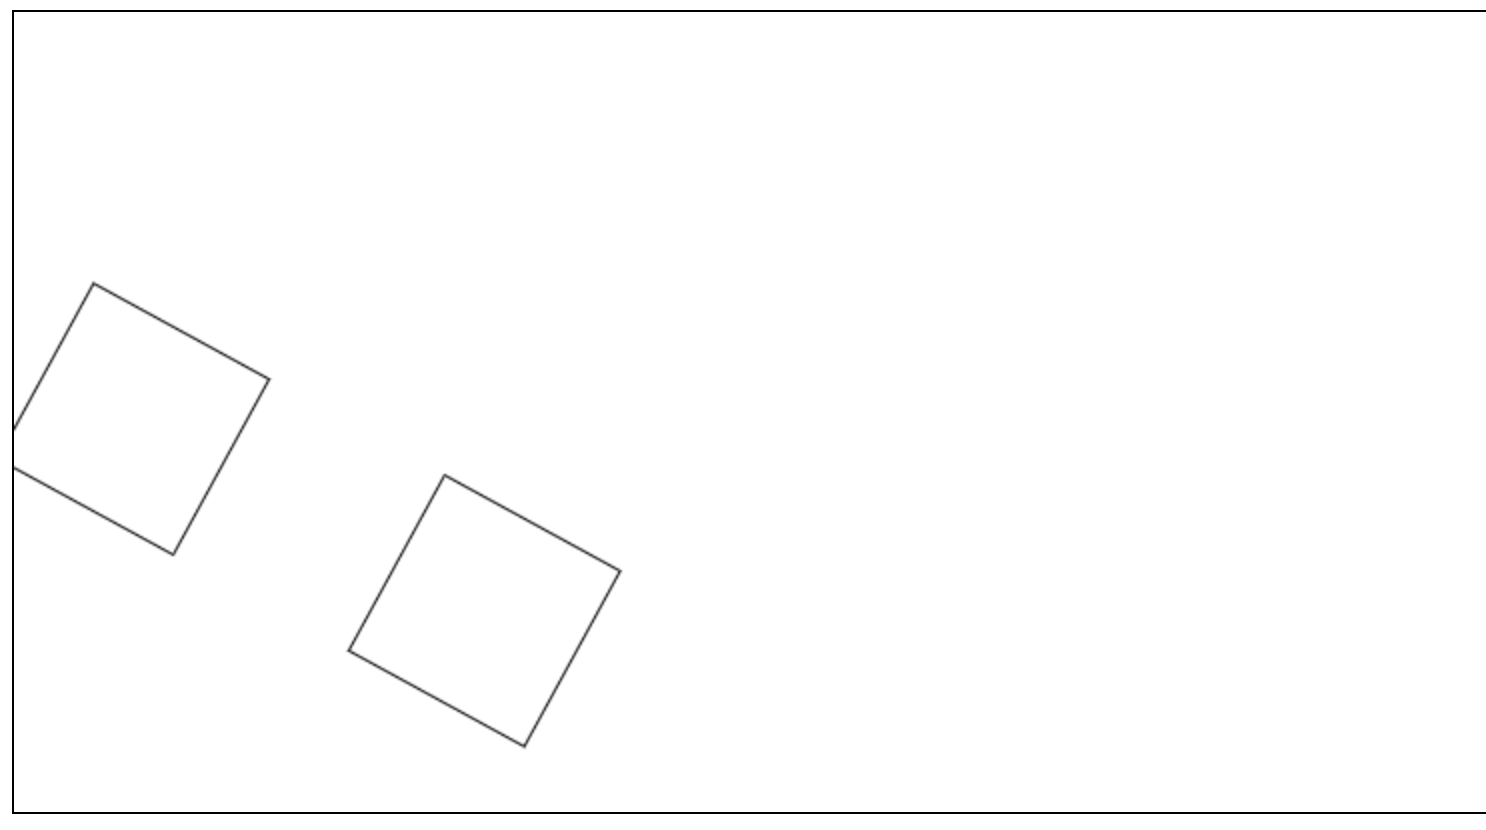
- canvas所有的转换操作都不只是在操作某个形状,而是对整个画布进行转换
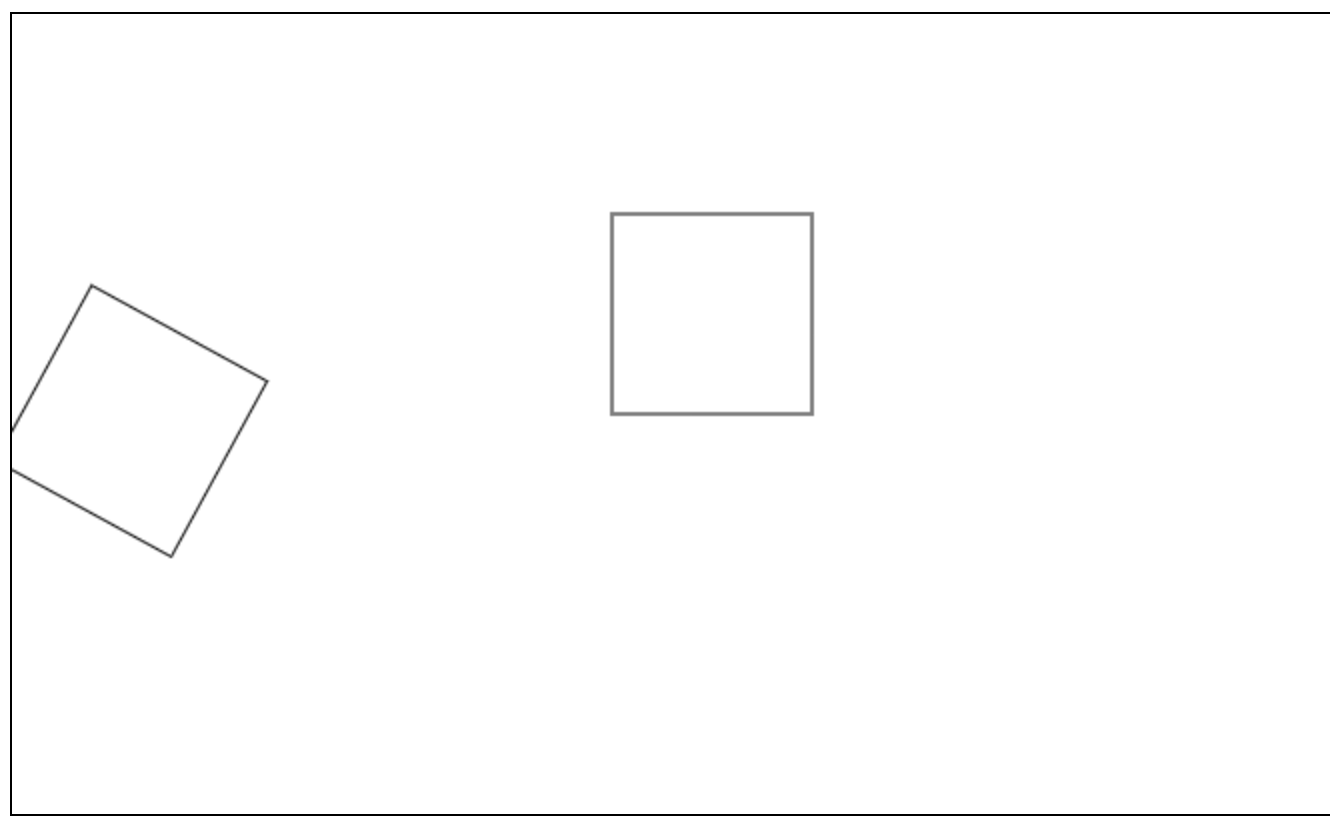
- 如果需要对多个形状进行不同的转换,在每次绘制之前都需要先保存画笔状态,绘制之后重置画笔状态
- 保存画笔状态:
ctx.save();- 一般存在于转换之前
- 重置画笔状态:
ctx.restore();- 一般存在于转换之后
- 保存画笔状态:
1 | // 绘制两个矩形 |
1 | // 对画布进行旋转 |
1 | // 将 旋转和其中一个矩形绘制 存储为一次记录 |
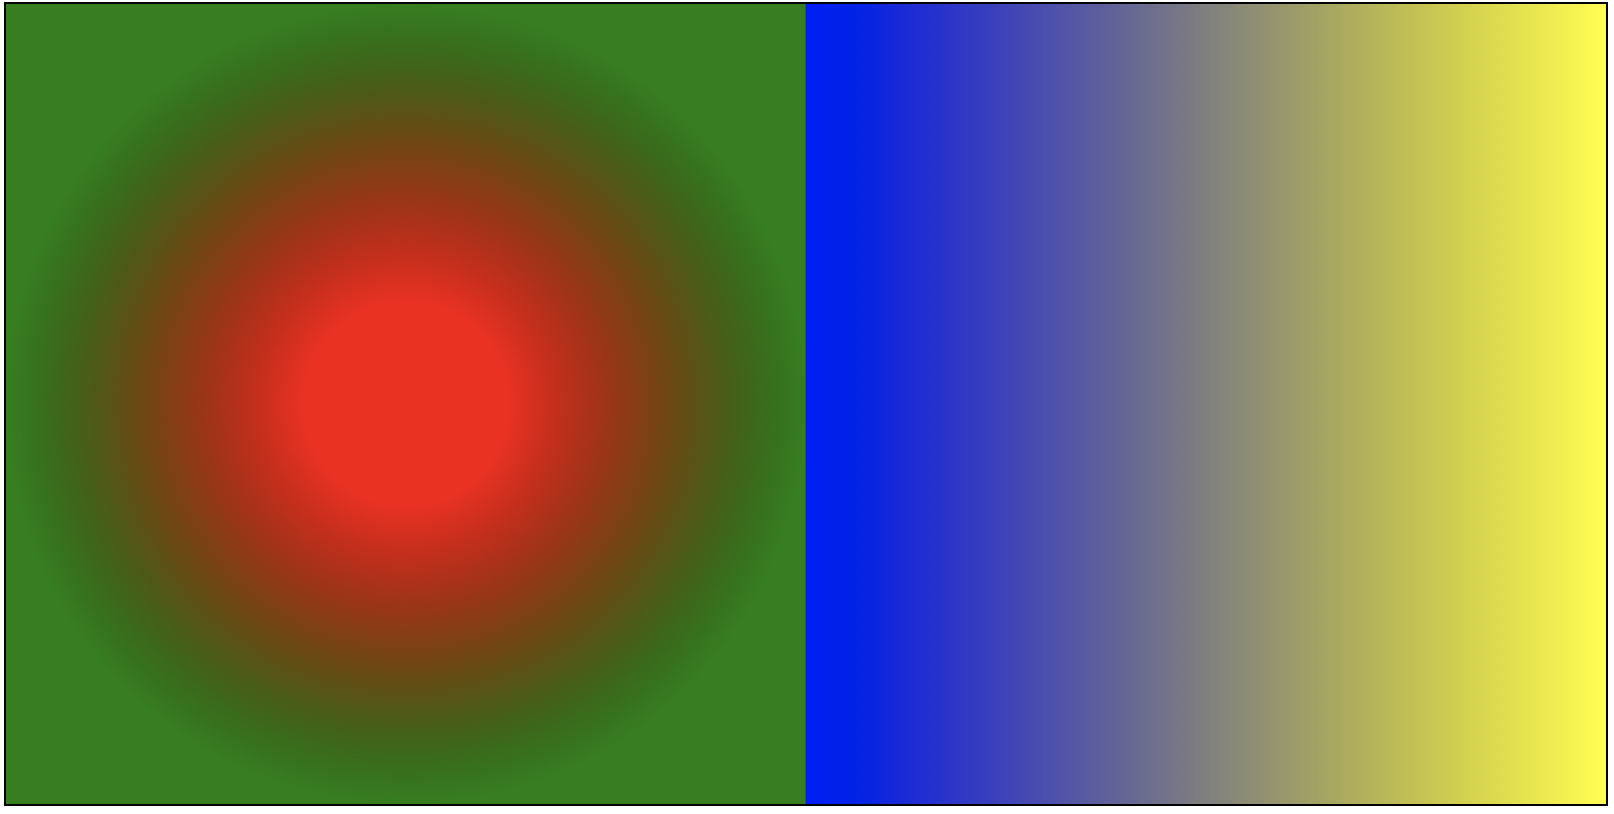
二、渐变色
- canvas的渐变色,就是提前配置好渐变色方案(从颜色1向颜色2过渡),然后将渐变色方案,设置给填充样式即可
- 渐变形式
- 线性渐变
- 创建渐变:
const lg = ctx.createLinearGradient(起点x坐标, 起点y坐标, 终点x坐标, 终点y坐标)- 指定渐变范围
- 添加渐变色:
lg.addColorStop(0, 'red')- 向指定位置添加颜色,0表示开始坐标,1表示结束坐标,中间部分会自动填充渐变色
- 创建渐变:
- 线性渐变
1 | const canvas = document.querySelector(".mycanvas"); |

- 径向渐变
    * 创建渐变:`const lg = ctx.createRadialGradient(x1, y1, r1, x2, y2, r2);`
        + <font style="color:#333333;">x1:起始圆圆心 x 轴坐标</font>
        + <font style="color:#333333;">y1:起始圆圆心 y 轴坐标</font>
        + <font style="color:#333333;">r1:起始圆半径</font>
        + <font style="color:#333333;">x2:终止圆圆心 x 轴坐标</font>
        + <font style="color:#333333;">y2:终止圆圆心 y 轴坐标</font>
        + <font style="color:#333333;">r2:终止圆半径</font>
    * 添加渐变色:`lg.addColorStop(0, 'red')`
        + 同线性渐变
1 | const canvas = document.querySelector(".mycanvas"); |

- 多区域不同渐变
- 本质为配置多套渐变方案,绘制到不同的形状
1 | const canvas = document.querySelector(".mycanvas"); |
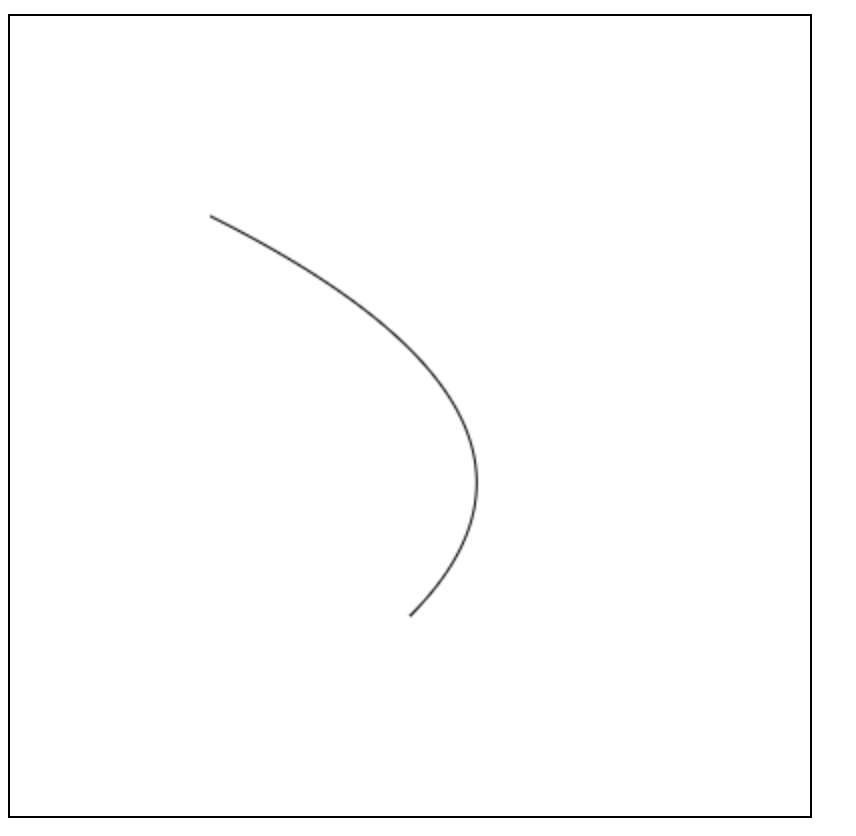
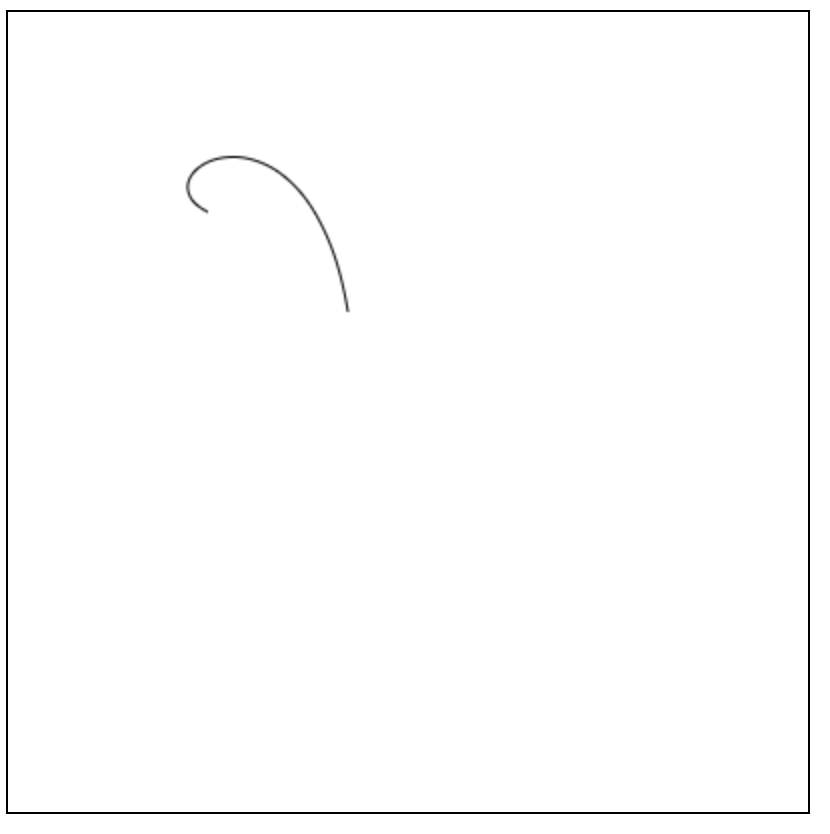
三、贝塞尔曲线
- 贝塞尔曲线(Bezier curve)是计算机图形学中相当重要的参数曲线,它通过一个方程来描述一条曲线,根据方程的最高阶数,又分为线性贝赛尔曲线,二次贝塞尔曲线、三次贝塞尔曲线和更高阶的贝塞尔曲线。
- 贝塞尔曲线需要提供几个点的参数,首先是 曲线的起点和终点
- 如果控制点数量为 0,我们称之为线性贝塞尔;
- 控制点数量为 1,则为二阶贝塞尔曲线;
- 控制点数量为 2,则为三阶贝塞尔曲线,依此类推。
- 二阶贝塞尔曲线
- 其实就是由 三个点 绘制成两个直线
- 然后同时从每条直线的起点开始,向终点移动,按比例拿到点。然后将这些点再连接,产生 n - 1 条直线。
- 就这样,我们继续同样的操作的,直到变成一条直线,然后再按比例取到一个点,这个点就是曲线经过的点。
- 当我们比例一点点变大(从 0 到 1),就拿到了曲线中间的所有点,最终绘制出完整的曲线。
- 再来看看三阶贝塞尔曲线
- 和二阶贝塞尔曲线是一个道理,只不过控制点数量变成了两个
- 在canvas中不需要我们手动计算这么多点,canvas直接提供了相关的API
- 二阶贝塞尔曲线:
ctx.quadraticCurveTo(p1x, p1y, p2x, p2y) - 三阶贝塞尔曲线:
ctx.bezierCurveTo(p1x, p1y, p2x, p2y, p3x, p3y) - 在此之前需要先使用 moveTo 确定 p0 的位置
- 二阶贝塞尔曲线:
二阶
1 | const cvs = document.querySelector(".cvs"); |
三阶
1 | const cvs = document.querySelector(".cvs"); |
多阶
1 | ctx.beginPath(); |
1 | ctx.moveTo(75, 40); |
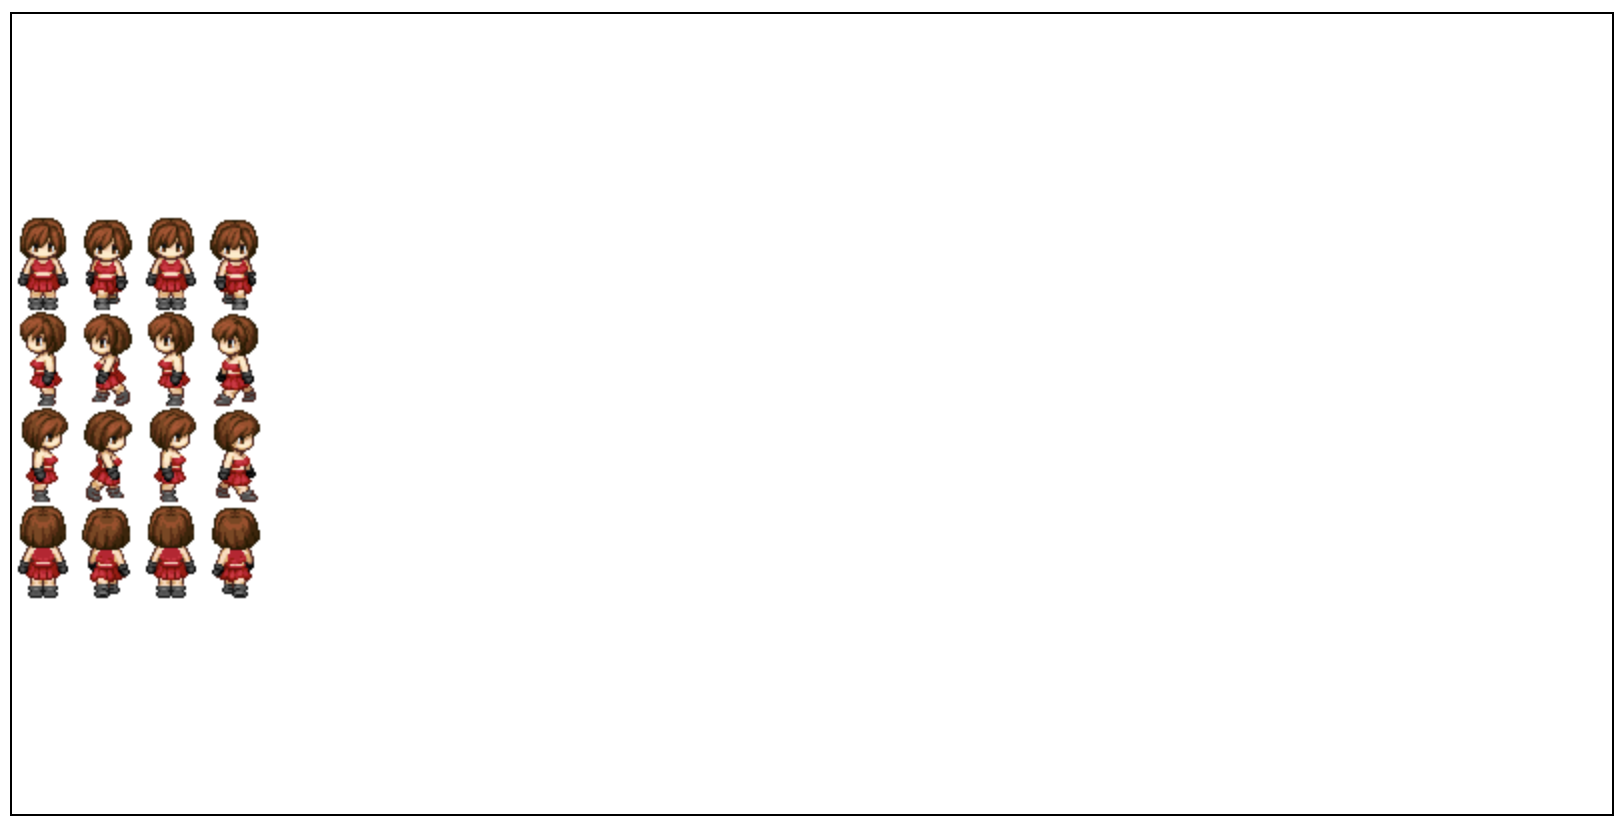
四、绘制图片
- 创建图片(非canvas操作)
- 创建图片对象:
const img = new Image(); - 设置资源地址:
img.src = "图片地址" - 资源加载完成:
img.onload = function(){ / * 图片加载完成 */ }
- 创建图片对象:
- 将图片绘制到canvas
- 三个参数:
gd.drawImage(图片对象, x, y)- 从画布的 x,y 坐标开始绘制
- 三个参数:
1 | const canvas = document.querySelector(".mycanvas"); |
- 五个参数:`gd.drawImage(图片对象, x, y, w, h)`
    * 从画布的 x,y 坐标开始绘制,绘制到 宽w,高h 的区域
1 | const canvas = document.querySelector(".mycanvas"); |
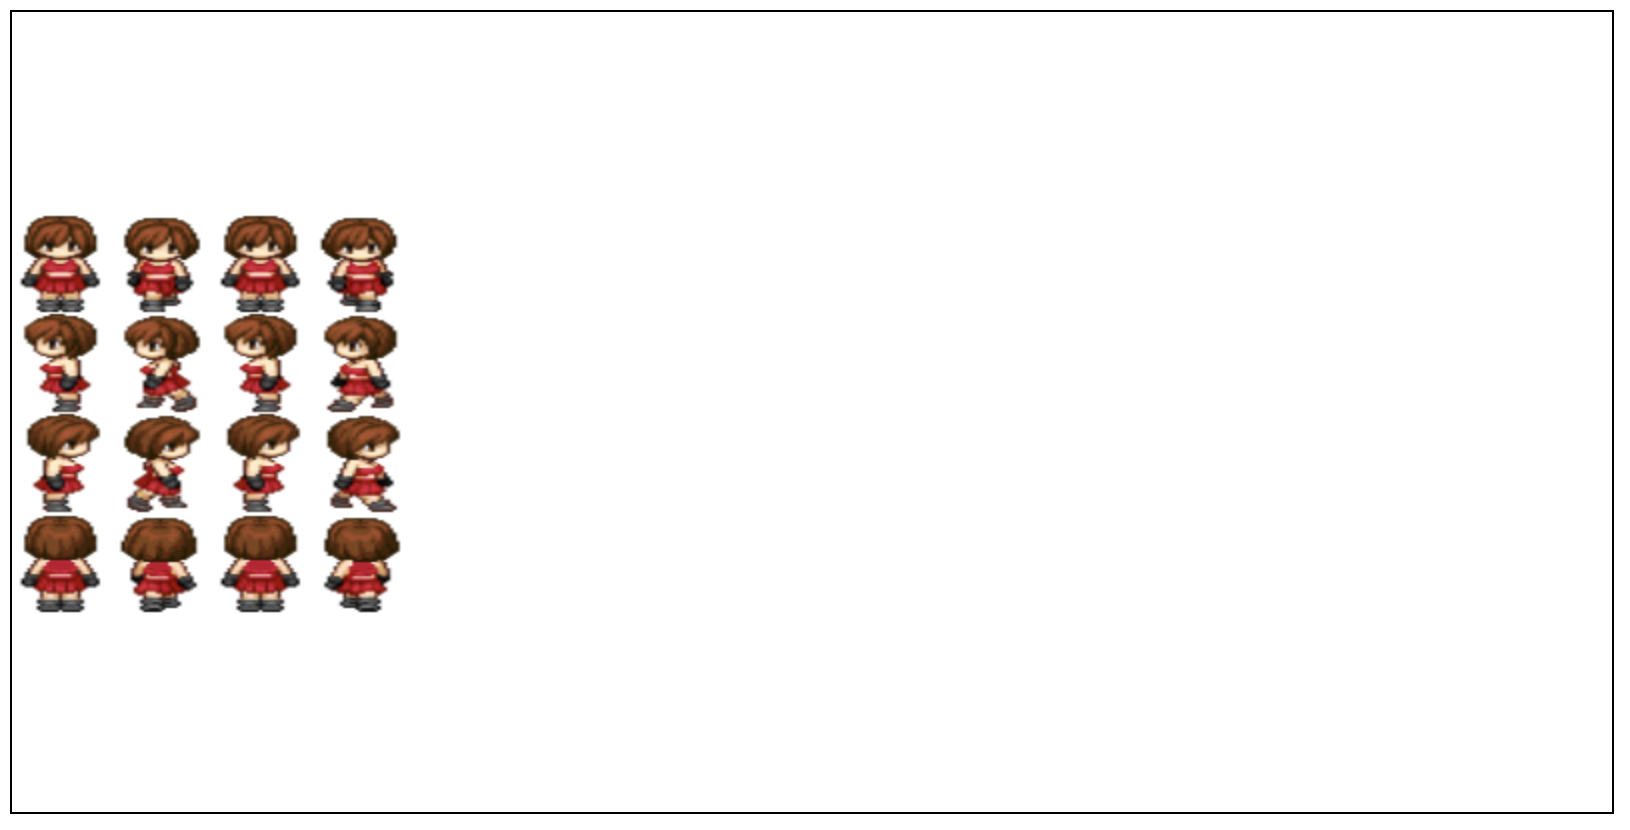
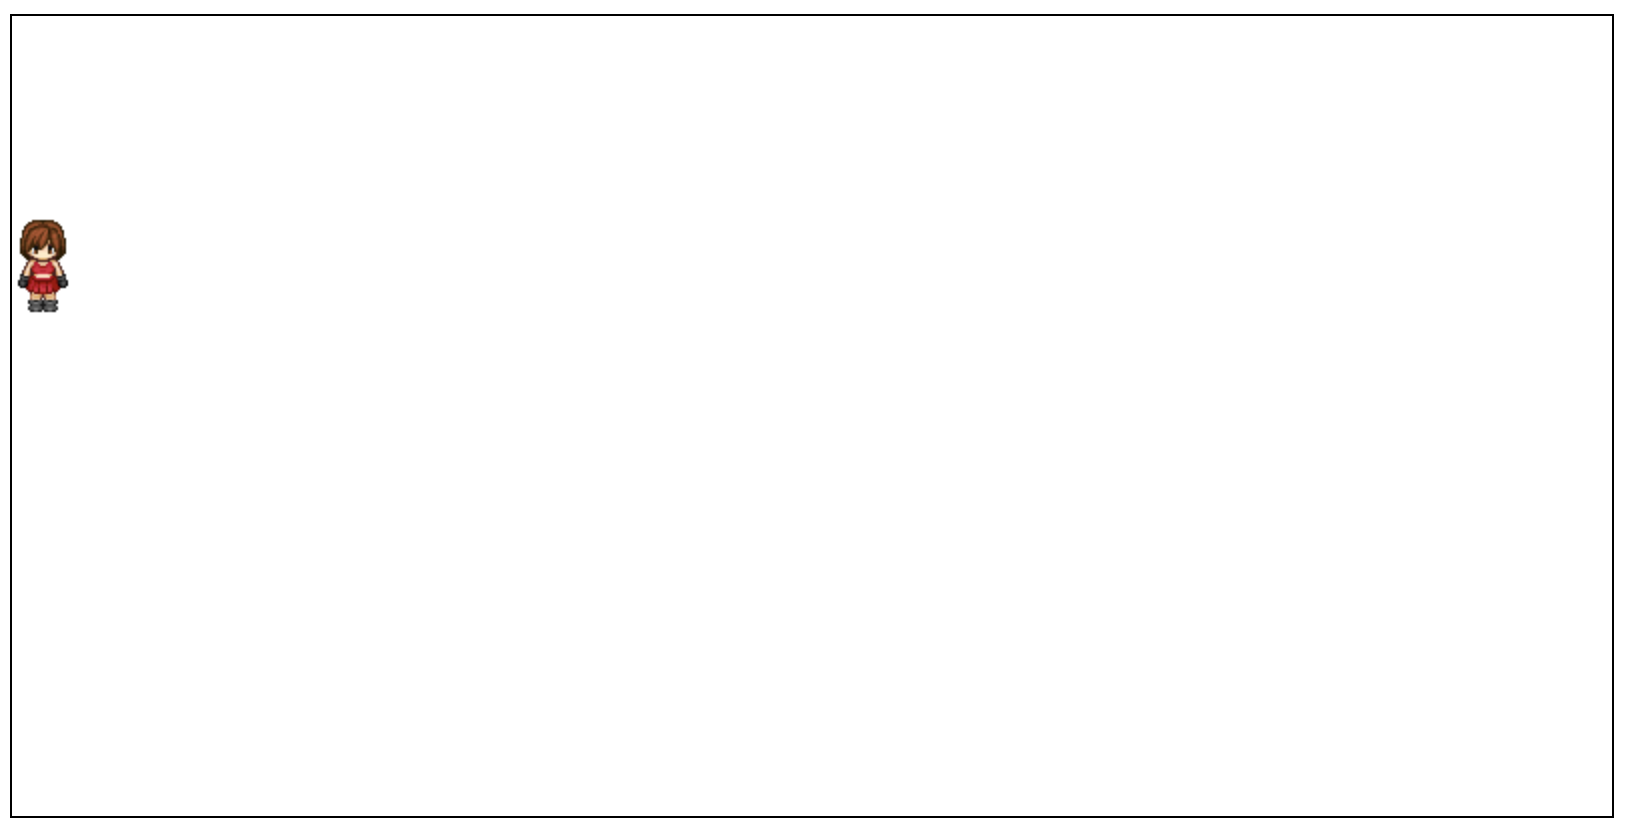
- 九个参数:`gd.drawImage(图片对象, sx, sy, sw, sh, dx, dy, dw, dh)`
    * s = source 原图    位置 宽高
    * d = destination 目标(画布)画在哪,画多大
1 | const canvas = document.querySelector(".mycanvas"); |
五、事件
- canvas内没有事件系统,只能通过给canvas元素添加事件,配合事件对象,手动检测事件区域
- 矩形检测公式:
点击x > 矩形x && 点击x < 矩形x + 矩形w && 点击y > 矩形y && 点击y < 矩形y + 矩形h
- 圆形检测公式:
- 利用勾股定理:a^2 + b^2 = c^2
- a = 圆心x - 点击x
- b = 圆心y - 点击y
- c = Math.sqrt( a * a + b * b )
- 若 c < r ,则在圆形区域内
- 自动检测
ctx.isPointInPath(x, y)- 返回值:布尔值,表示指定坐标是否在一个路径范围内
六、导出(了解)
1 | download.onclick = function(){ |
七、总结
- 位移:
ctx.translate(x, y) - 旋转:
ctx.rotate(弧度值) - 缩放:
ctx.scale(x, y) - 保存画笔状态:
ctx.save() - 重置画笔状态:
ctx.restore() - 创建线性渐变:
const lg = ctx.createLinearGradient(起点x坐标, 起点y坐标, 终点x坐标, 终点y坐标) - 创建径向渐变:
const lg = ctx.createRadialGradient(x1, y1, r1, x2, y2, r2); - 添加渐变色:
lg.addColorStop(0, 'red') - 绘制图片:
gd.drawImage(图片对象, x, y) - 检测指定坐标是否在某个路径范围内:
ctx.isPointInPath(x, y)
八、拓展 - requestAnimationFrame
本博客所有文章除特别声明外,均采用 CC BY-NC-SA 4.0 许可协议。转载请注明来源 !
评论